Risk disclosure: Independent research finds 70–84% of Polymarket traders lose money (Sergeenkov, April 2026; Akey et al., SSRN, March 2026). Forex CFDs: 70–85% retail loss rate. Binary options: 80%+ in most jurisdictions. AI agents don't change these baselines. Full disclaimer. Security context: Three critical CVEs disclosed in OpenClaw in Q1 2026 (CVE-2026-25253, CVE-2026-32922) plus the ClawHavoc supply-chain attack (1,184 malicious skills). Always run v2026.4.12 or later. Full security assessment.
Grid trading is one of the most popular automated strategies, and one of the most misunderstood. The idea is elegant: place a ladder of buy and sell orders across a price range, profiting from oscillations as price bounces up and down. In the right market — sideways and choppy — it can generate steady returns. In the wrong market — a strong trend — it bleeds money relentlessly. This guide covers how grid trading actually works, when to use it, and the realistic returns (not the 20%/month the YouTube ads promise).
We'll build a grid bot conceptually in OpenClaw, explain the math, and — most importantly — be honest about when this strategy destroys accounts.
TL;DR — The 30-second answer
- The idea: ladder of buy/sell orders across a range; profit from oscillations.
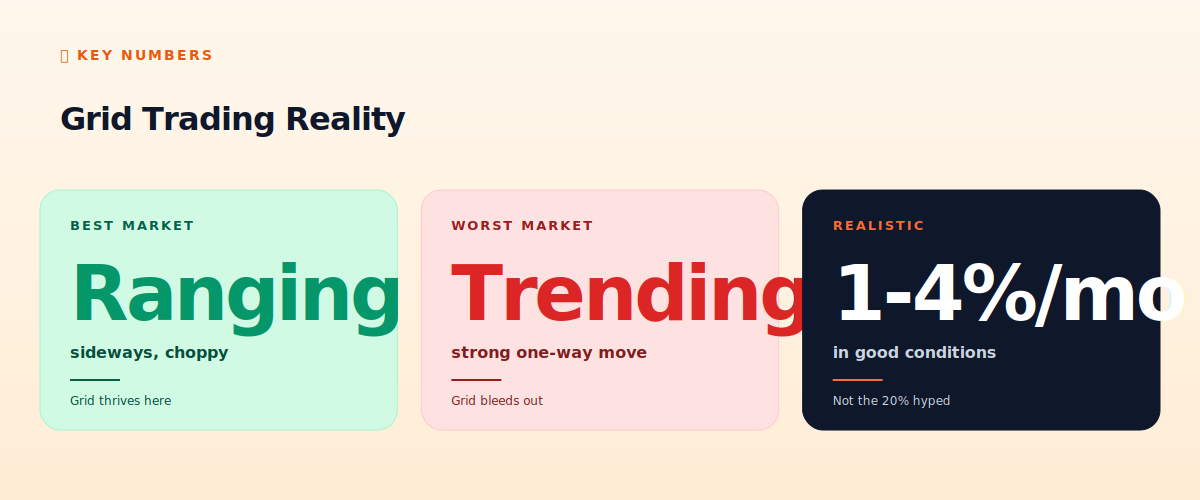
- Best market: ranging/sideways. Grid thrives on choppy, bounded price action.
- Worst market: strong trends. A one-way move leaves you holding losers.
- Realistic returns: 1-4%/month in good conditions, not the hyped 20%.
- The killer: a trend that breaks your range and keeps going.
- OpenClaw fit: good — the LLM can detect regime and pause the grid.
How grid trading works
Imagine BTC trading between $90,000 and $100,000. A grid bot divides that range into levels — say, every $1,000 — and places a buy order at each level below the current price and a sell order at each level above. As price oscillates, the bot buys low and sells high automatically: price drops to $95K, a buy fills; price rises to $96K, a sell fills, capturing $1,000 of profit on that unit. Repeat across the range, all day, automatically.
In a sideways, choppy market, this is genuinely effective — the bot captures profit on every oscillation without needing to predict direction. The more the price bounces within the range, the more the grid earns. This is grid trading's appeal: it makes money from volatility without forecasting.
The math and parameters
A grid is defined by three parameters: the range (upper and lower price bounds), the grid count (how many levels), and the investment per level. Tighter grids (more levels) capture smaller oscillations more frequently but with smaller per-trade profit; wider grids capture bigger moves less often. The profit per completed buy-sell cycle is roughly the grid spacing minus fees, so fees matter enormously — a grid that trades constantly on a high-fee exchange can have its profits eaten alive.
This is why grid traders favor low-fee venues (Binance, OKX — see our comparison) and often use maker orders to earn rebates rather than pay taker fees.
When grid trading blows up
Here's the part the marketing omits. Grid trading's fatal weakness is a strong trend that breaks your range. Suppose your grid is set for $90K-$100K and BTC crashes to $70K. As price falls through your range, the bot keeps buying at each level — $95K, $94K, $93K... — accumulating a growing bag of losing positions. When price exits the bottom of your range, you're left holding a stack of BTC bought far above the current price, with no sell orders filling. You're deep underwater, and the grid can't help because there's nothing below the range.
The same happens (less painfully) on strong upward trends — the bot sells its inventory early and then sits in cash watching price run away, capturing none of the upside. Either way, a strong trend is grid trading's enemy. Most retail grid blowups come from setting a grid in what looks like a range, then a trend emerging.
Where OpenClaw helps
This is where an LLM-driven approach adds genuine value over a dumb grid bot. OpenClaw can monitor for regime change — detecting when a market is transitioning from ranging to trending — and pause or adjust the grid before it bleeds out. A traditional grid bot mechanically keeps trading into a trend; OpenClaw can reason: 'this is no longer a range, the grid assumption is broken, halt and alert.' That judgment layer is exactly what separates a smart grid from an account-destroyer.
A conceptual OpenClaw grid skill: define the range and levels, place the grid, but add a regime-detection check on every heartbeat — if price approaches a range boundary with strong momentum, or volatility spikes beyond a threshold, halt the grid and alert via Telegram (see our Telegram guide). The hard guardrails (max drawdown, position cap) still apply on top.
Realistic returns
Honest numbers: a well-run grid in favorable (ranging) conditions might produce 1-4% per month. The '20% monthly grid bot' claims are either cherry-picked from one good month, ignore the catastrophic month when a trend hit, or are outright marketing fiction. Grid trading is a modest, conditional strategy — good in ranges, dangerous in trends — not a money printer. Anyone promising consistent high returns from grid trading is selling the dream, not the reality (see hype vs reality).
Should you use it?
Grid trading suits traders who: understand it's range-dependent, can identify (or let OpenClaw detect) ranging conditions, use low-fee venues, set appropriate range boundaries, and — critically — have a hard rule to halt when a trend breaks the range. It's a reasonable strategy in the right hands and the right market. It's an account-destroyer for those who set it and forget it through a trend. As always: paper trade first, start small, and never deploy capital you can't lose.
📧 Get every new tutorial in your inbox
One email per week. Tutorials, CVE disclosures, broker updates. Unsubscribe in one click.
(Connect FluentCRM / ConvertKit / Beehiiv form here)
Frequently asked questions
What market is best for grid trading?
Ranging, sideways, choppy markets where price oscillates within bounds. Grid thrives on volatility without direction.
When does grid trading lose money?
Strong trends. A one-way move that breaks your range leaves you holding losing positions (downtrend) or sitting in cash missing upside (uptrend).
What returns are realistic?
1-4% per month in favorable conditions. The '20% monthly' claims are cherry-picked or fiction — they ignore the month a trend wipes out the gains.
How does OpenClaw improve a grid bot?
It can detect regime change (ranging to trending) and pause the grid before it bleeds — judgment a dumb grid bot lacks.
Do fees matter for grid trading?
Enormously. Grids trade frequently, so high fees eat profits. Use low-fee venues and maker orders where possible.
What to read next
- Mean Reversion Strategies for Crypto Bots
- Building a Multi-Strategy Portfolio
- Binance vs Bybit vs OKX for Bots
- The 12-Point Hardening Checklist
Sources cited: The Hacker News (CVE-2026-25253 disclosure, Feb 2026); Conscia 2026 OpenClaw Security Crisis advisory; Snyk ToxicSkills study; Cyber Press ClawHavoc reporting; Wall Street Journal Polymarket profitability analysis (May 2026); Andrey Sergeenkov via The Defiant (April 2026); Akey, Grégoire, Harvie & Martineau, SSRN paper (March 2026); openclaw.ai official advisories; Peter Steinberger public statements on X. grid trading mechanics from exchange documentation; OpenClaw strategy patterns.