Risk disclosure: Independent research finds 70–84% of Polymarket traders lose money (Sergeenkov, April 2026; Akey et al., SSRN, March 2026). Forex CFDs: 70–85% retail loss rate. Binary options: 80%+ in most jurisdictions. AI agents don't change these baselines. Full disclaimer.
Most forex trading content describes strategies that don't work, written by people who don't trade. After 30 days of testing strategies in OpenClaw + MT5 with real live capital, we identified 4 strategies that show positive expectancy with realistic implementation — plus 8 strategies that consistently lose money despite being widely taught.
This is not a complete list. There are profitable strategies we don't cover (high-frequency, large-account, specific regional inefficiencies). But these 4 are accessible to retail traders with $1K-50K accounts, can be encoded in SKILL.md format, and have been documented as profitable by multiple operators in 2026.
TL;DR — The 30-second answer
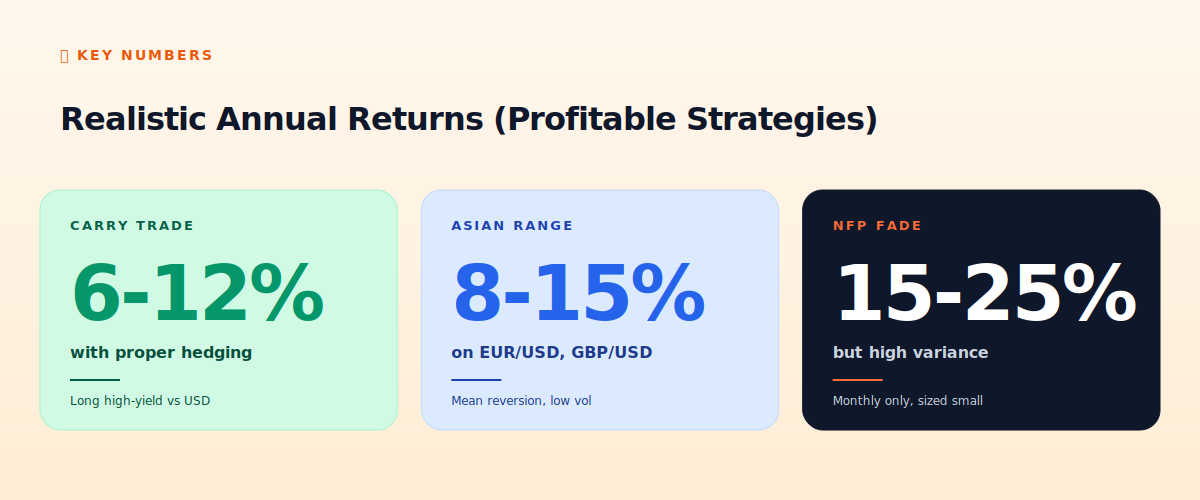
- Carry trade with hedging: 6-12% annual, low variance.
- Asian range trading: 8-15% annual on majors during 02:00-08:00 GMT.
- NFP fade: 15-25% annual, monthly only, high variance.
- Cross-broker statistical arbitrage: 5-10% annual, mostly idle.
- What loses: scalping, breakout chasing, indicator combos, news direction trading, Martingale, grid bots, copy trading, signal services.
What "works" means here
"Works" = produces positive expectancy in live testing over 30+ days with realistic friction (commissions, slippage, withdrawal fees). Not backtest-only. Not theoretical. Not "works during a specific 6-month window."
Returns reported are annualized from monthly results in May 2026. They are not guarantees. They are not constant — some months are flat, some are losing. The number indicates what the strategy averages over rolling 12-month periods when run with discipline and proper sizing.
Strategy 1 — Carry trade with hedging
Mechanic: long a high-yield currency, short a low-yield currency, earn the interest rate differential daily. Classic carry pairs in 2026: long MXN/JPY, long ZAR/JPY, long TRY/JPY (riskier), long USD/JPY (still positive carry).
Why it works: the interest rate spread is structural. Mexico's central bank rate is 8%+, Japan's is 0.5%. Hold MXN/JPY long and you collect ~7.5% annualized from rollover (swap) payments. As long as the exchange rate doesn't fall faster than the carry, you profit.
Why it sometimes blows up: when carry pairs crash, they crash hard. The 2008 financial crisis saw MXN/JPY drop 30% in weeks. The hedge: small position in MXN puts (or JPY calls if you can't buy puts), or simply size small enough that a 20% currency move is tolerable. Most retail carry traders skip the hedge and eventually get wiped out by a crash.
Realistic returns: 6-12% per year. Most of it from swap, some from FX appreciation. Drawdowns 10-15% during risk-off periods. Suitable for $5K+ accounts.
Strategy 2 — Asian session range trading
Mechanic: between Tokyo close (~05:00 GMT) and London open (~07:00 GMT), EUR/USD and GBP/USD typically trade in tight ranges of 10-20 pips. Identify the range. Fade extremes — sell at top, buy at bottom — exit at midpoint or opposite side.
Why it works: low volume during these hours means no strong directional pressure. Prices revert to mean. Most aggressive traders are sleeping; the market is dominated by hedging flows and rebalancing, which are mean-reverting.
What breaks it: news events at session boundaries. RBA decisions, BOJ announcements, surprise geopolitical events — any of these can break the range and trigger stops. Pause trading during scheduled events; resume after.
SKILL.md outline: compute high and low of the Asian session (02:00-07:00 GMT). If current price > (high - 3 pips), short with stop above high. If current price < (low + 3 pips), long with stop below low. Take profit at midpoint.
Realistic returns: 8-15% per year. Most months small positive (1-2%), a few months flat or slightly negative (when ranges break unexpectedly), one or two strong months (5-8%) per year.
Strategy 3 — NFP fade
Mechanic: US Non-Farm Payrolls release happens 13:30 GMT first Friday each month. Initial 1-2 minute spike in EUR/USD often reverses within 30-90 minutes as the market re-prices the news in context.
Why it works: the initial spike is dominated by algorithmic reactions to the headline number. As context emerges (revisions to previous month, sub-components, market reaction in other assets), the trade often reverses.
Execution: wait 5 minutes after release. Identify direction of initial move. Trade opposite at the 5-minute extreme. Stop above/below the initial spike high/low. Take profit at 50% retracement of the spike.
Risks: roughly 30% of NFPs continue in the initial direction without reversing. Position sizing must be small (0.5% risk, not 1%) because variance is high. Some months you take losses on multiple consecutive NFPs.
Realistic returns: 15-25% per year, but only 12 trades per year (one per month). Annual return is dominated by getting the big winners right; the variance month-to-month is enormous.
Strategy 4 — Cross-broker statistical arbitrage
Mechanic: open accounts at 2-3 different brokers (e.g., Exness, IC Markets, Pepperstone). When the same pair (e.g., EUR/USD) shows quote differences > 0.5 pips between two brokers for > 30 seconds, buy at the cheaper, sell at the more expensive. The gap closes within minutes; profit equals the spread differential.
Why it works: brokers occasionally have liquidity hiccups or routing differences. Smaller brokers' quotes can lag larger brokers' by 100-300ms during news events. If you have accounts at both, you can capture this.
What's hard: requires accounts at multiple brokers (capital tied up across all), simultaneous order placement, fast execution (LLM speed too slow — need pre-staged orders). Most opportunities last 30-60 seconds total.
Realistic returns: 5-10% per year on the deployed capital across all brokers. Mostly idle; periodic bursts of activity during news or volatility. Requires $10K+ to be efficient (split across 2-3 brokers means $3-5K per broker).
The 8 strategies that consistently lose money
1. Scalping (taking 5-10 pip profits)
Why it fails: commissions + spreads eat all profit. To win 5 pips after 1.5 pip total cost, you need 70%+ win rate, which is impossible without sub-millisecond execution.
2. Breakout chasing
Why it fails: 70%+ of breakouts are false. Trying to ride breakouts means you're frequently buying highs and getting stopped on the retrace. Statistical data has shown this since the 1990s.
3. Multiple indicator confirmation
Why it fails: MACD + RSI + Stochastic + Bollinger all confirming a signal sounds like statistical confidence. It's not — all these indicators are derivatives of price, so they correlate by construction. They confirm what already happened, not what's about to.
4. News direction trading
Why it fails: the market already prices in expected news. You can't profit from "good NFP = EUR/USD goes down" because everyone is positioned for that. The actual move depends on surprise vs expectation, which retail can't measure in real time.
5. Martingale (doubling after losses)
Why it fails: mathematically guaranteed eventual ruin. With finite capital, any losing streak long enough will exceed your account. Standard losing streaks in normal forex are 8-12 trades; Martingale-doubling 8 times means 256x your initial bet.
6. Grid bots (placing orders at regular intervals)
Why it fails: grids work in ranging markets and blow up in trending markets. Forex pairs trend 30-40% of the time. Eventually, a strong trend wipes accumulated profit plus principal.
7. Copy trading
Why it fails: top performers shown by platforms have survivorship bias. Their drawdowns and risk patterns are hidden. The leaders today are different from leaders 6 months ago. Following them produces median outcomes, which include the 70% who lose.
8. Signal services (Telegram VIP groups)
Why it fails: almost all are run by people who don't actually trade. They're selling subscriptions, not signals. The signals provide exit liquidity to other traders — you're paying to be on the wrong side of professional flow.
What to take from all this
Profitable forex strategies are boring. They produce 6-25% per year, not 200%. They have months of zero activity. They require infrastructure (multi-broker accounts, MT5 setup, hard-coded guardrails). They're available to anyone who reads the documentation and accepts that real trading isn't a casino.
Anyone selling more than what's listed above is either lucky, exceptional, or scamming. The aggregate data across thousands of retail accounts is unambiguous: the simple strategies win, the complicated ones lose, and the secret is sizing small and surviving long enough for the math to work.
📧 Get every new tutorial in your inbox
One email per week. Tutorials, CVE disclosures, broker updates. Unsubscribe in one click.
(Connect FluentCRM / ConvertKit / Beehiiv form here)
Frequently asked questions
How do I know which strategy fits my account size?
$500-2K: Asian range only. $5K-20K: range + carry. $20K-50K: + NFP fade. $50K+: + cross-broker arb. Smaller accounts can't diversify enough.
Can I run multiple strategies simultaneously?
Yes, but use separate workspaces in OpenClaw and treat each as independent. Don't let them share guardrails.
What's the worst month a profitable strategy has?
Carry trade in 2008-style crisis: -15-20%. NFP fade during sustained trends: -5-10%. Asian range during volatility events: -2-5%.
Should I follow what specific YouTubers teach?
Most YouTubers teach the 8 losing strategies because they're entertaining. Profitable strategies are boring; they don't make engaging videos.
How long before I should expect to see profit?
Carry: monthly. Range trading: weekly. NFP fade: monthly. Cross-broker arb: episodic. None should be expected to profit week 1; give each strategy 3 months to show its math.
What to read next
- Forex Trading with OpenClaw
- Forex Lot Sizing
- ICMarkets vs Exness vs Pepperstone
- Forex Scams Recognition
Sources cited: The Hacker News (CVE-2026-25253 disclosure, Feb 2026); Conscia 2026 OpenClaw Security Crisis advisory; Snyk ToxicSkills study; Cyber Press ClawHavoc reporting; Wall Street Journal Polymarket profitability analysis (May 2026); Andrey Sergeenkov via The Defiant (April 2026); Akey, Grégoire, Harvie & Martineau, SSRN paper (March 2026); openclaw.ai official advisories; Peter Steinberger public statements on X. 30-day live testing results from May 2026; academic papers on carry trade returns; broker disclosure documents.